What are Cryptocurrency Candlesticks?
At BCB Group, we provide a variety of clients with solutions to integrate digital assets into their businesses. Naturally, our conversations with our clients often lead to trading and the indicators investors might use when making decisions, including discussions on candlestick charts and patterns.
To those new to crypto trading, it isn’t always clear how they can be used and how their use might differ from technical analysis in other fields. In this article, we provide an introduction to cryptocurrency candlesticks. The themes covered are:
- What are candlestick charts in crypto?
- How can you identify a candlestick pattern in a crypto chart?
- How can you understand these types of cryptocurrency charts?
- The most common types of candlestick patterns in crypto charts.
Get in touch with our team to learn more about how BCB Group could enable you to leverage digital assets.
What are Candlestick Charts in Crypto?
Candlestick charts originated as price charts in Japanese rice trading in the 17th century. Traders relied on a combination of candlesticks to anticipate price movements. Since the 19th century, they have become a standard tool for working on predictive models projecting the growth or decline of an asset.
Analysing candlesticks forms part of technical analysis, contrasting with fundamental analysis. In traditional markets, the fundamental analysis evaluates how a business is doing by looking at its balance sheet, revenue, customer base, and future outlook. When looking at the fundamentals of a cryptocurrency, investors will often research the underlying technology, the Tokenomics (fiscal policy) of a protocol, community support, adoption in terms of wallets created, smart contracts, active users, and more. Similar to other assets, cryptocurrencies don’t exist in a vacuum, so macroeconomic factors will often impact the price of digital assets.
Candlestick trading provides a different way of trading which focuses on taking data from previous market cycles to predict how an asset will trade in the future. Candlestick charts visually represent an asset’s trading history over time and enables traders to gain perspective and project the future direction.
The most visible part of a single candlestick is its body, either filled in green or red. The body represents the price range between the opening and closing prices over a specific timeframe which traders can configure.
The lines extending beyond the body to the top and bottom are called “wick” or shadow, with the upper wick indicating the highest price the asset traded at during a session and the lower wick marking the lowest price.
When the closing price of a candle is higher than its opening price, the price of an asset increases and the green color of the candlestick visually highlights it. Green candles are also referred to as bullish candles.
Bullish refers to traders’ sentiment and outlook. When bullish, they are optimistic about the future of an asset and see its direction move up. The opposite of bullish is bearish. Red candles are also called bearish candles as they display a decrease in an asset’s price.
While looking at one candle can already tell a story, it’s usually a combination of candles that hints at a broader trend and offers the context necessary for trading.
How to Identify a Candlestick Pattern in a Crypto Chart?
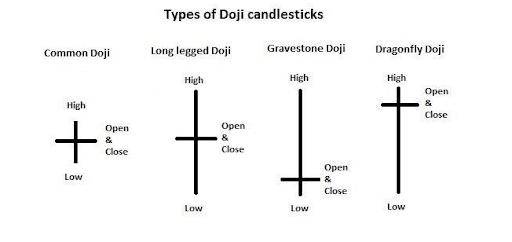
Before introducing a few candlestick patterns, it’s worth highlighting that, in some cases, one single candle can offer a great glimpse at the market. In particular, the so-called Doji candles stand out. Traders can easily spot them due to their small bodies and long wicks. They come in three different categories:
- Long-Legged: with the upper and lower wick roughly equally long, which indicates that the market is experiencing a lot of uncertainty.
- Gravestone: as the name suggests, the gravestone has a big top wick and expresses that a high price was rejected and emotions toward the asset were negative during the session.
- Dragonfly: is a sign of a session-long bear run that ended with a comeback to the starting price.
Looking beyond single candles, there are various patterns that candlesticks can form, from very basic to more advanced formations. Every pattern consists of a combination of candlesticks that hint at price developments and if the market is bearish or bullish.
To speak of a pattern, one must evaluate at least two candles; experienced traders will rely on more than these to get to a conclusive analysis. The more data, the clearer the picture becomes.
How to Spot Patterns in Crypto Charts?
Cryptocurrencies are trading 24/7 providing a vast amount of price charts and candlesticks to analyse. Overall, recognising a broader trend can often be achieved with a simple look at the charts and an estimate of where prices are headed. Yet, there are levels of depth one can go into during this analysis.
Support and resistance are critical price levels to watch out for when trying to spot candlestick patterns. Both cover broader chart areas. Support is the price that holds the downward market movements during a given period. For Bitcoin, the $20,000 price was often referred to as its support in September, which it has since broken. Similarly, resistance is a price limiting an asset’s upwards movements. Check out our market rundowns for an analysis of the latest market movements.
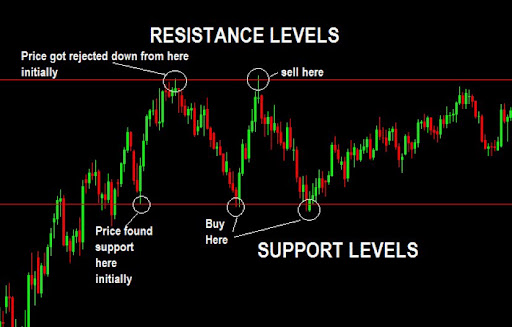
Both are price levels at which markets bounce off. Whenever one of these levels breaks, it’s best practice to wait for a confirmation of a trend before entering a position. These are also good points to start looking for candlestick patterns.
How Can You Understand these Types of Cryptocurrency Charts?
Upward Trend
We speak of an upward trend whenever an asset is trading upwards, with its price consistently increasing over a longer timeframe. This applies even when there are a variety of red candles spread throughout it. The chart shows a bullish market as long as the overall direction is upwards.
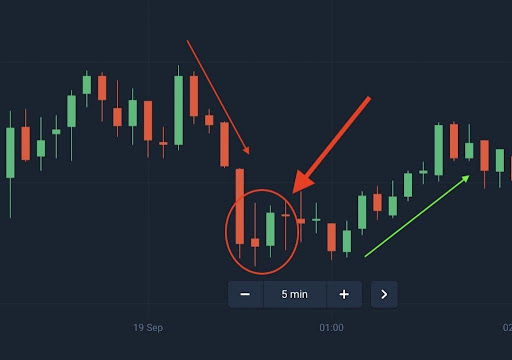
Downward Trend
The downward trend is a persistent decrease in an asset’s price, with candlesticks showing lower lows and lower highs. It’s indicative of a bearish market.
Consolidation Trends
During consolidation, the asset trades in a range without clearly indicating where the price will go. This can occur within either upward or downward trends.
Determining the end of a trend goes beyond just looking at candlestick charts and often will require taking into account indicators such as moving averages.
Important Factors to Consider
Traders can pick the timeframe that fits their strategy when looking at charts. An hour or less might be appropriate for intraday trading but not long-term investments. Higher time frames often provide a more accurate price prediction.
Additionally, traders should consider that candlestick patterns at random places in a chart often don’t carry valuable insights. It’s better to view support and resistance levels and patterns arising from that.
Lastly, in crypto, in particular, volatility is expected, and occasionally markets will move outside of candlestick patterns based on news or rumours. It’s advised to hedge against these risks.
The Most Common Types of Candlestick Patterns in Crypto Charts
After identifying the broader price trends, the next step is looking for candlestick patterns in crypto charts. Traders will come across a variety of different patterns providing valuable insights.
Bullish and Bearish Engulfing
The bullish or bearish engulfing consists of 2 candlesticks. When a red candle is followed by a bullish candle that completely engulfs the previous candle, we speak of a bullish engulfing. Bearish engulfing describes the opposite pattern. This pattern shows that sentiment is about to change and that an asset is set to experience a bullish or bearish movement.
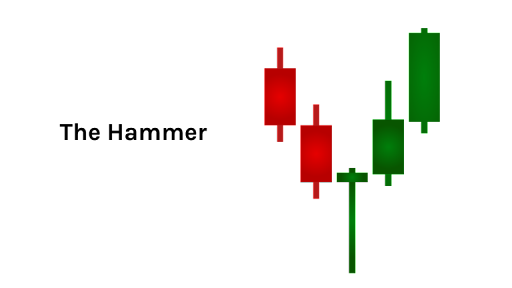
Hammer Candlestick
The hammer only has one wick pointing down, giving it its name. Usually, the wick is roughly double the length of the body. The body sits on top, and there is no upper wick. A hammer can be either red or green, and it’s confirmed by the candle that follows it. If the neckline (the top of the candle’s body) is met or exceeded by the following candle, the hammer is confirmed. A hammer indicates a significant change in trend. During a bearish movement, the hammer candle is often the first after a period of high selling pressure to show that the bottom is in. Note there is also an inverted hammer with an upper wick which is also a sign of a coming uptrend.
Shooting Star
The shooting star pinpoints the peak of a trend after an asset has been trading in an uptrend for a longer time. It’s composed of a candlestick with a tiny lower wick, a small body, and a long upper wick. You will quite frequently encounter these on crypto charts. The long wick and small body denote a rejection of a high price after a rise and usually precede a bearish reversal.

Hanging Man
Like the shooting star, the hanging man pinpoints a reversal in trend. For it to be a hanging man pattern, it must follow a recognisable price rise. The candle it’s formed of is also known as spinning top for its small body.
Triangle Patterns
When following traders on Twitter, you will eventually come across charts in which they’ve painted triangles. These triangle patterns act as horizontal trading patterns and add further insights to technical analysis.
We differentiate between three types of triangle patterns: ascending, descending, and symmetrical.
Ascending Triangles: denote a breakout pattern. They appear when prices surpass resistance levels. The resistance paints a horizontal line and the upper line of the triangle follows the higher lows.
Descending Triangles: indicates that the bears are winning ground, moving the price of an asset down. In this case, the support line forms one side of the triangle, and the other lines follow the decreasing lower highs.
Symmetrical Triangles: formed by a combination of higher and lower highs. Therefore neither buyers nor sellers dominate, and the price is trading sideways. It can break out in either way and form new patterns.
Conclusion
Recognising candlestick patterns and knowing how to read crypto charts can be helpful in making more informed trading decisions.
An understanding of charts can be a pillar of success in markets. This article provided the first foray into candlesticks in crypto charts but is by no means exhaustive. Traders track a wide range of patterns and it often takes significant experience to leverage them with consistent success.
Candlesticks are a great tool to enhance investment decisions, particularly in crypto markets, but should not be relied on in isolation.
BCB Group comprises BCB Prime Services Ltd (UK), BCB Payments Ltd (UK), BCB Digital Ltd (UK) and BCB Prime Services (Switzerland) LLC. BCB Payments Ltd is regulated by the Financial Conduct Authority, no. 807377, under the Payment Services Regulations 2017 as an Authorised Payment Institution. BCB Prime Services (Switzerland) LLC, a company incorporated under the laws of the Swiss Confederation in the canton of Neuchâtel with business identification number CHE-415.135.958, is an SRO member of VQF, an officially recognized self-regulatory organization (SRO) according to the Swiss Anti-Money Laundering Act. This update: 14 Oct 2020.
The information contained in this document should not be relied upon by investors or any other persons to make financial decisions. It is gathered from various sources and should not be construed as guidance. The information contained herein is for informational purposes only and should not be construed as an offer, solicitation of an offer, or an inducement to buy or sell digital assets or any equivalents or any security or investment product of any kind either generally or in any jurisdiction where the offer or sale is not permitted. The views expressed in this document about the markets, market participants and/or digital assets accurately reflect the views of BCB Group. While opinions stated are honestly held, they are not guarantees, should not be relied on and are subject to change. The information or opinions provided should not be taken as specific advice on the merits of any investment decision. This document may contain statements about expected or anticipated future events and financial results that are forward-looking in nature and, as a result, are subject to certain risks and uncertainties, such as general economic, market and business conditions, new legislation and regulatory actions, competitive and general economic factors and conditions and the occurrence of unexpected events. Past performance of the digital asset markets or markets in their derivative instruments is not a viable indication of future performance with actual results possibly differing materially from those stated herein. We will not be responsible for any losses incurred by a client as a result of decisions made based on any information provided.
Related Insights

The Ultimate Guide to Tokenization
READ
Crypto – Where to Start?
READ
Guest Blog: A Primer on Stablecoins
READ
Centralised vs. Decentralised Exchanges
READ
Your Guide to Cryptocurrency
READ
What is Proof of Stake (PoS)?
READ
NFTs in 2022: What to Expect
READ